Morphology (SPA)#
Simplified Pattern Analysis (SPA) is a streamlined version of the MSPA approach. It classifies pixels of a binary foreground/background image into morphological classes based on their spatial context, offering four different classification levels (2, 3, 5, or 6 classes). Further details about SPA and MSPA are available in the MSPA product sheet.
SPA Classes#
The number of morphological classes in the output depends on the classes parameter.
The following table describes the byte values and categories for each level:
Level |
Byte Value |
Class Name |
|---|---|---|
2 classes |
17, 1 |
Contiguous, Margin |
3 classes |
17, 1, 100 |
Core, Margin, Core Opening |
5 classes |
17, 3, 5, 1, 100 |
Core, Edge, Perforation, Margin, Core Opening |
6 classes |
17, 3, 5, 9, 1, 100 |
Core, Edge, Perforation, Islet, Margin, Core Opening |
Note
In all modes, Background is represented by value 0, and No Data is represented by 129.
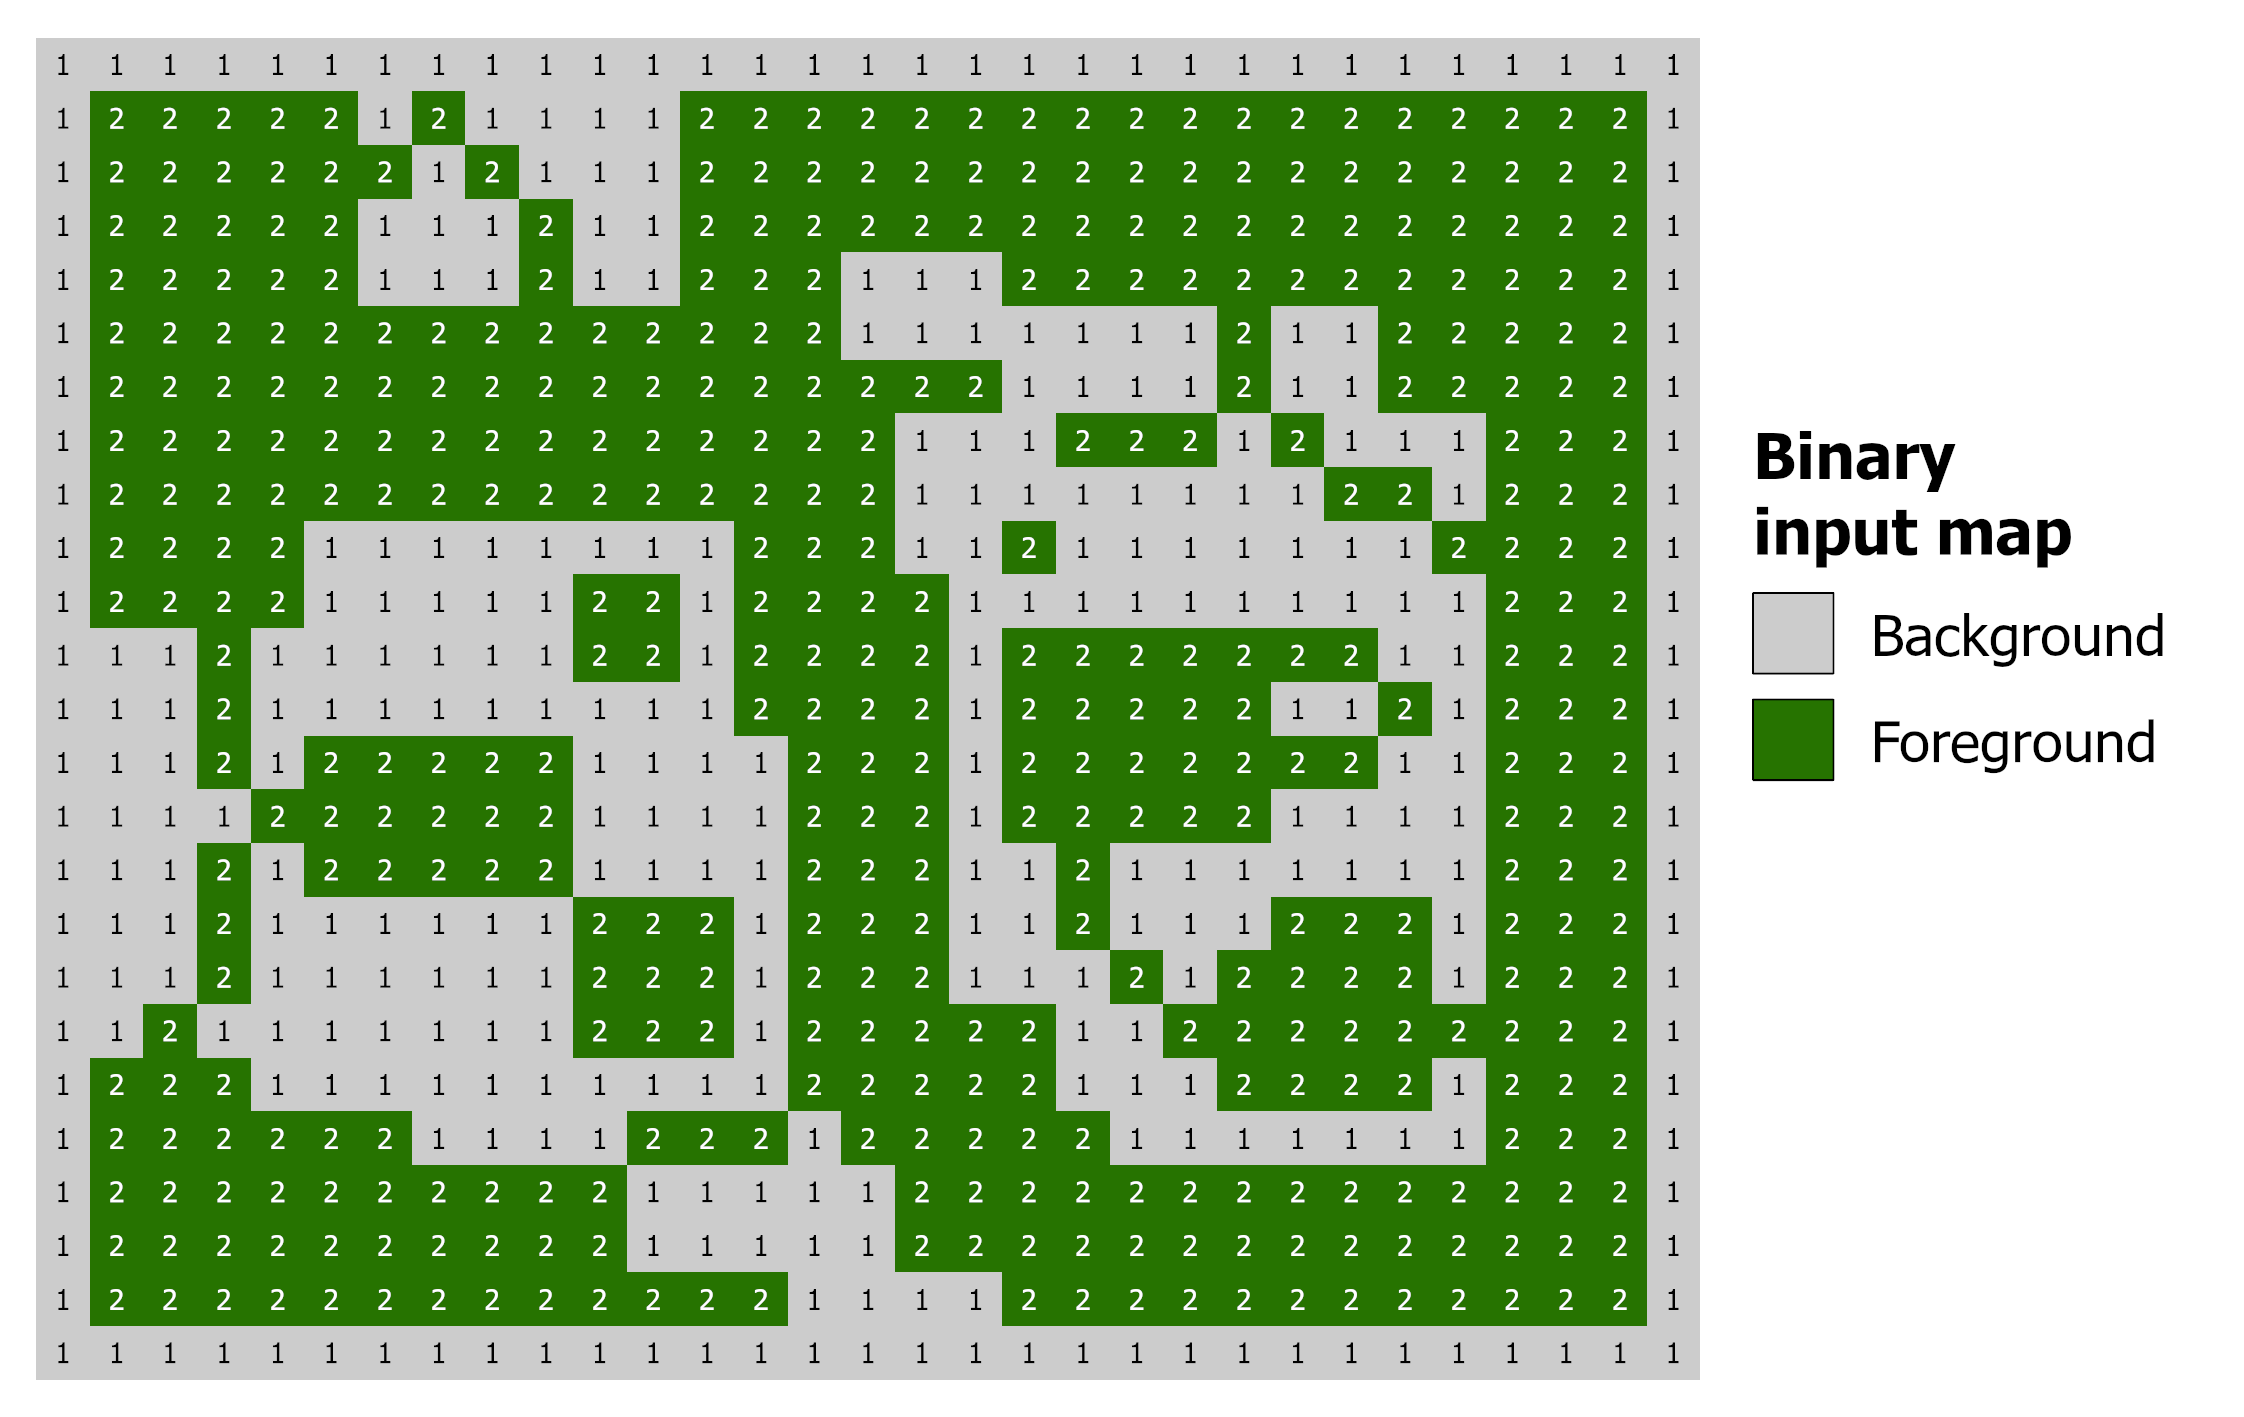
Example of input binary map.#
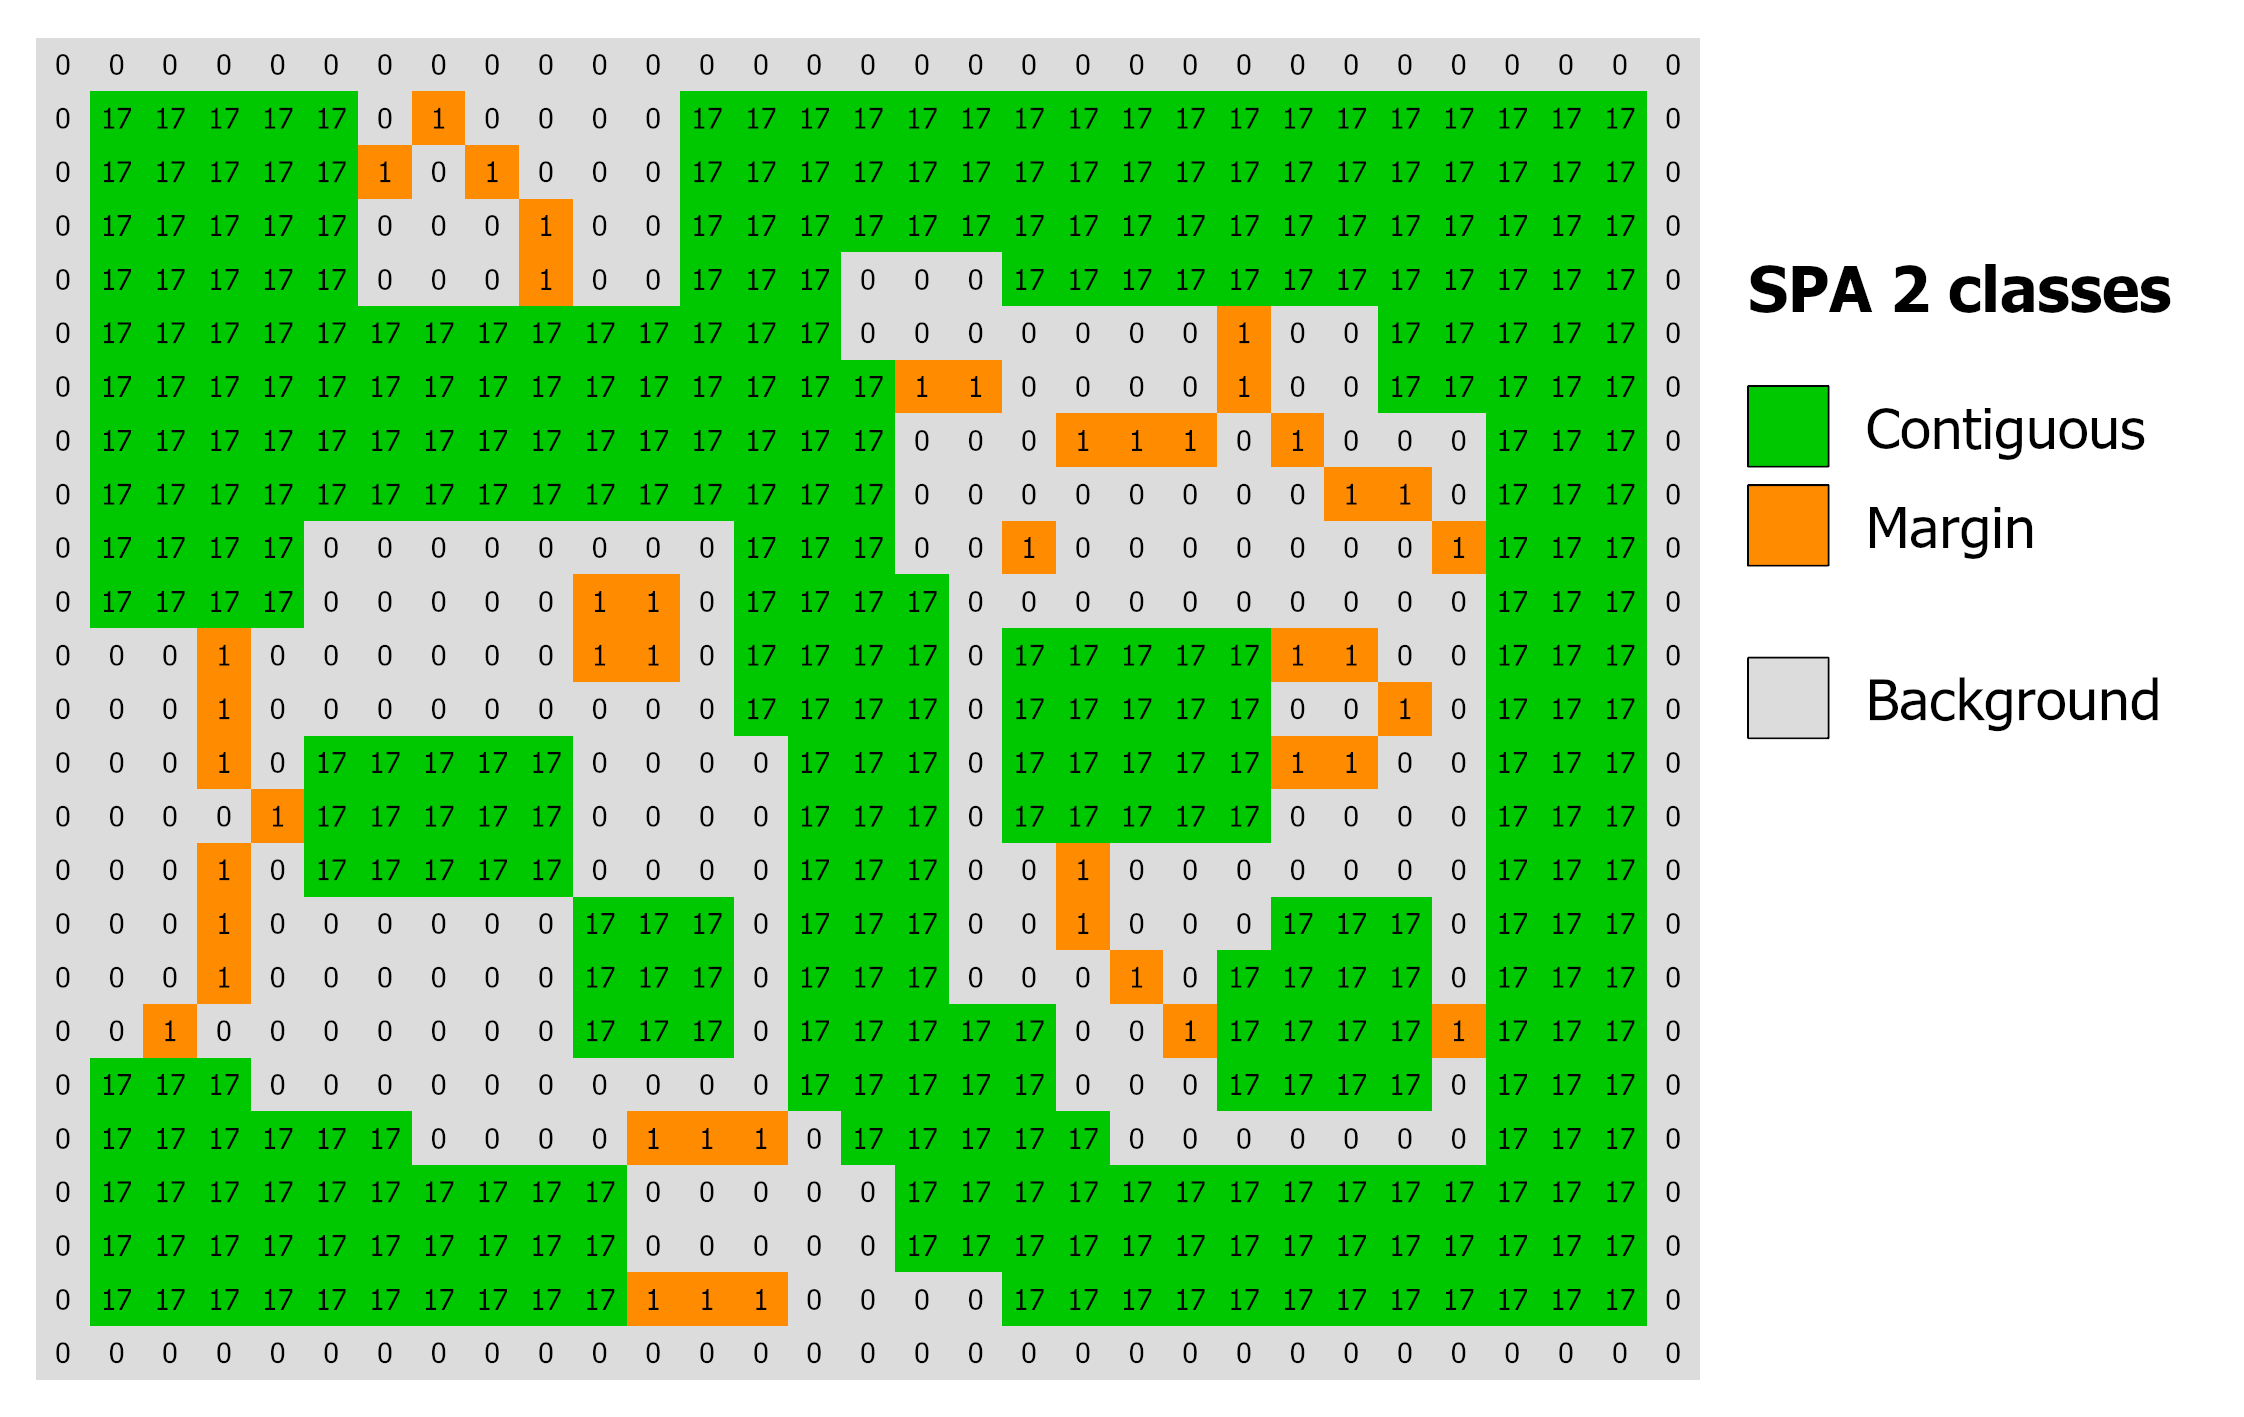
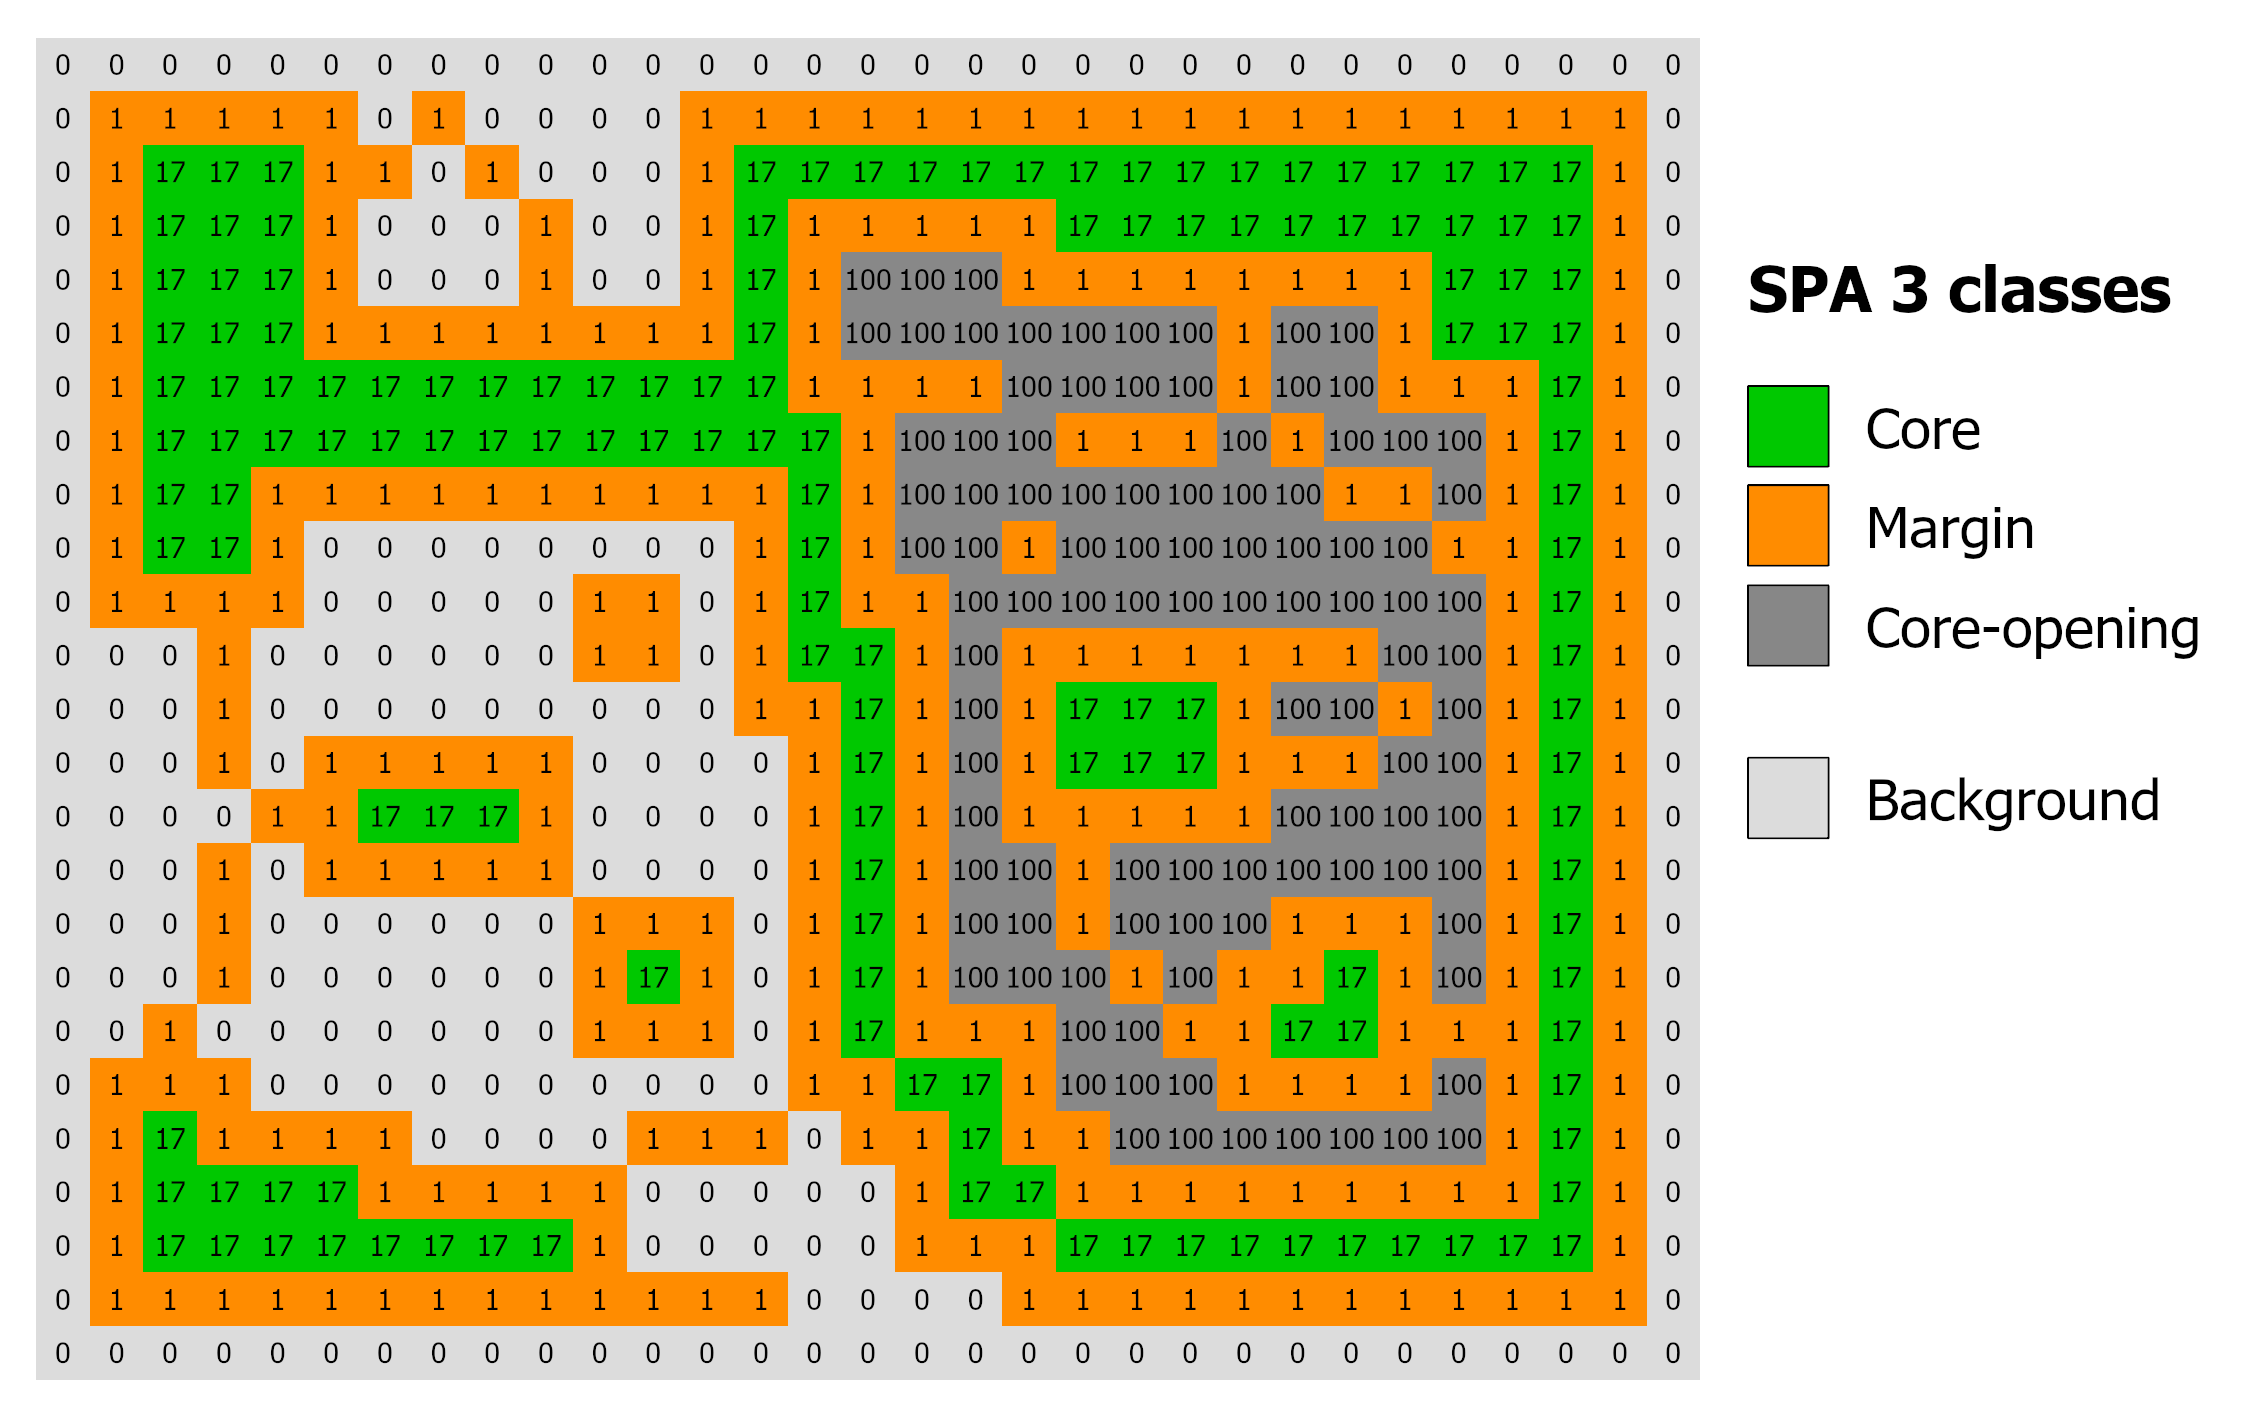
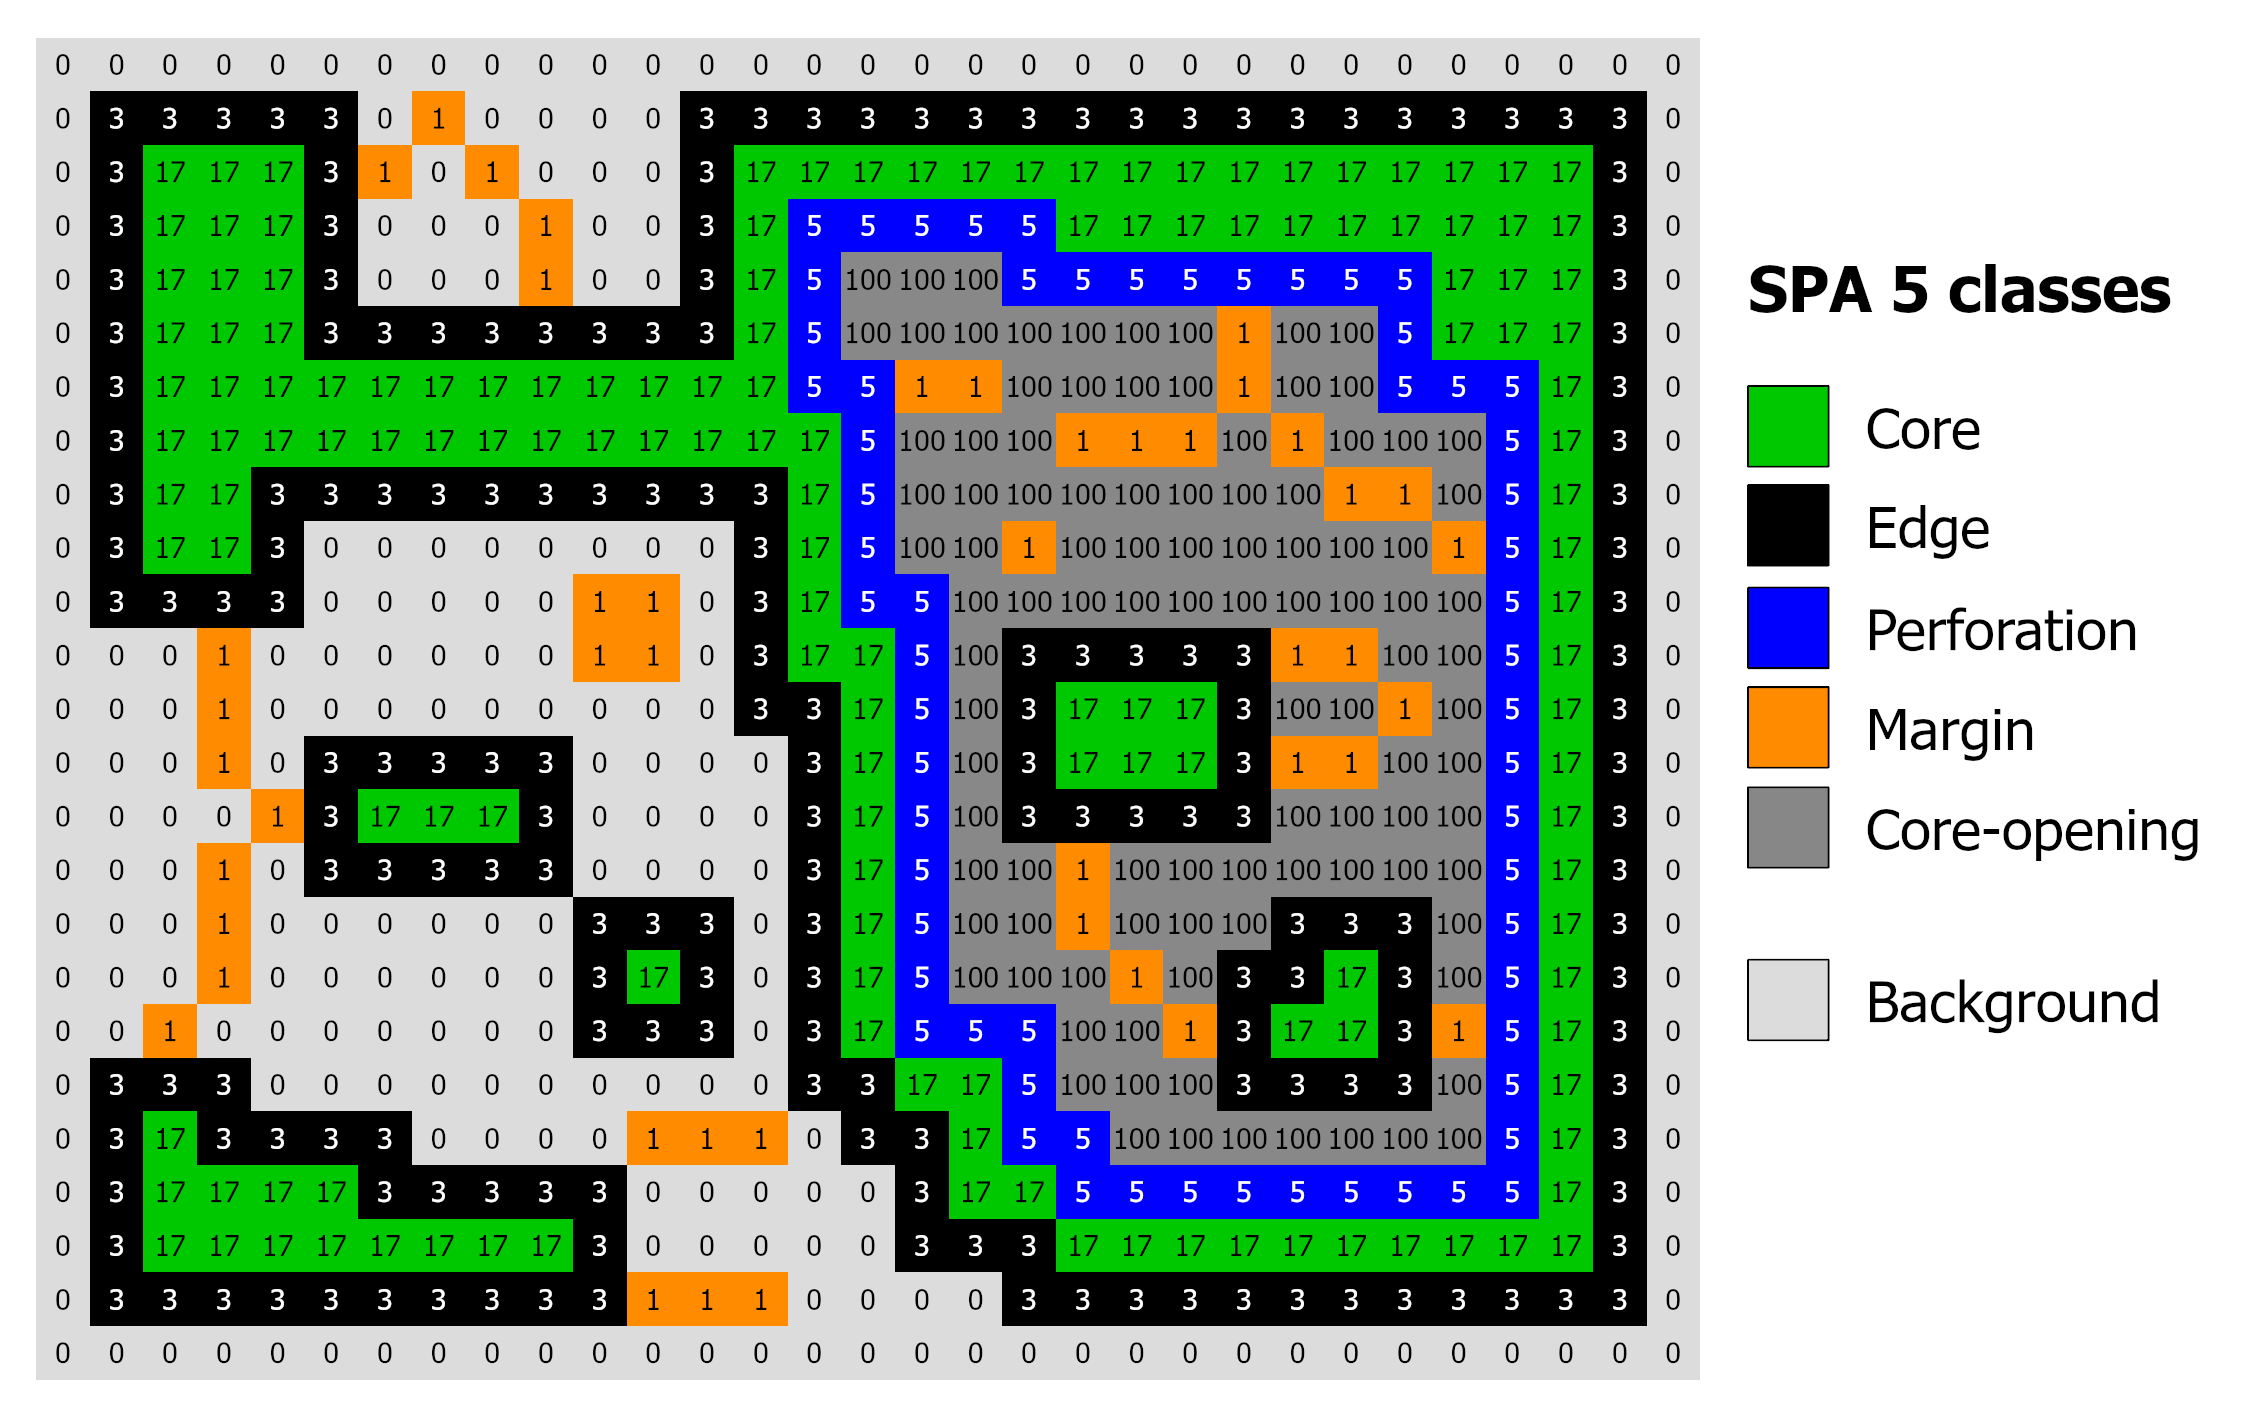
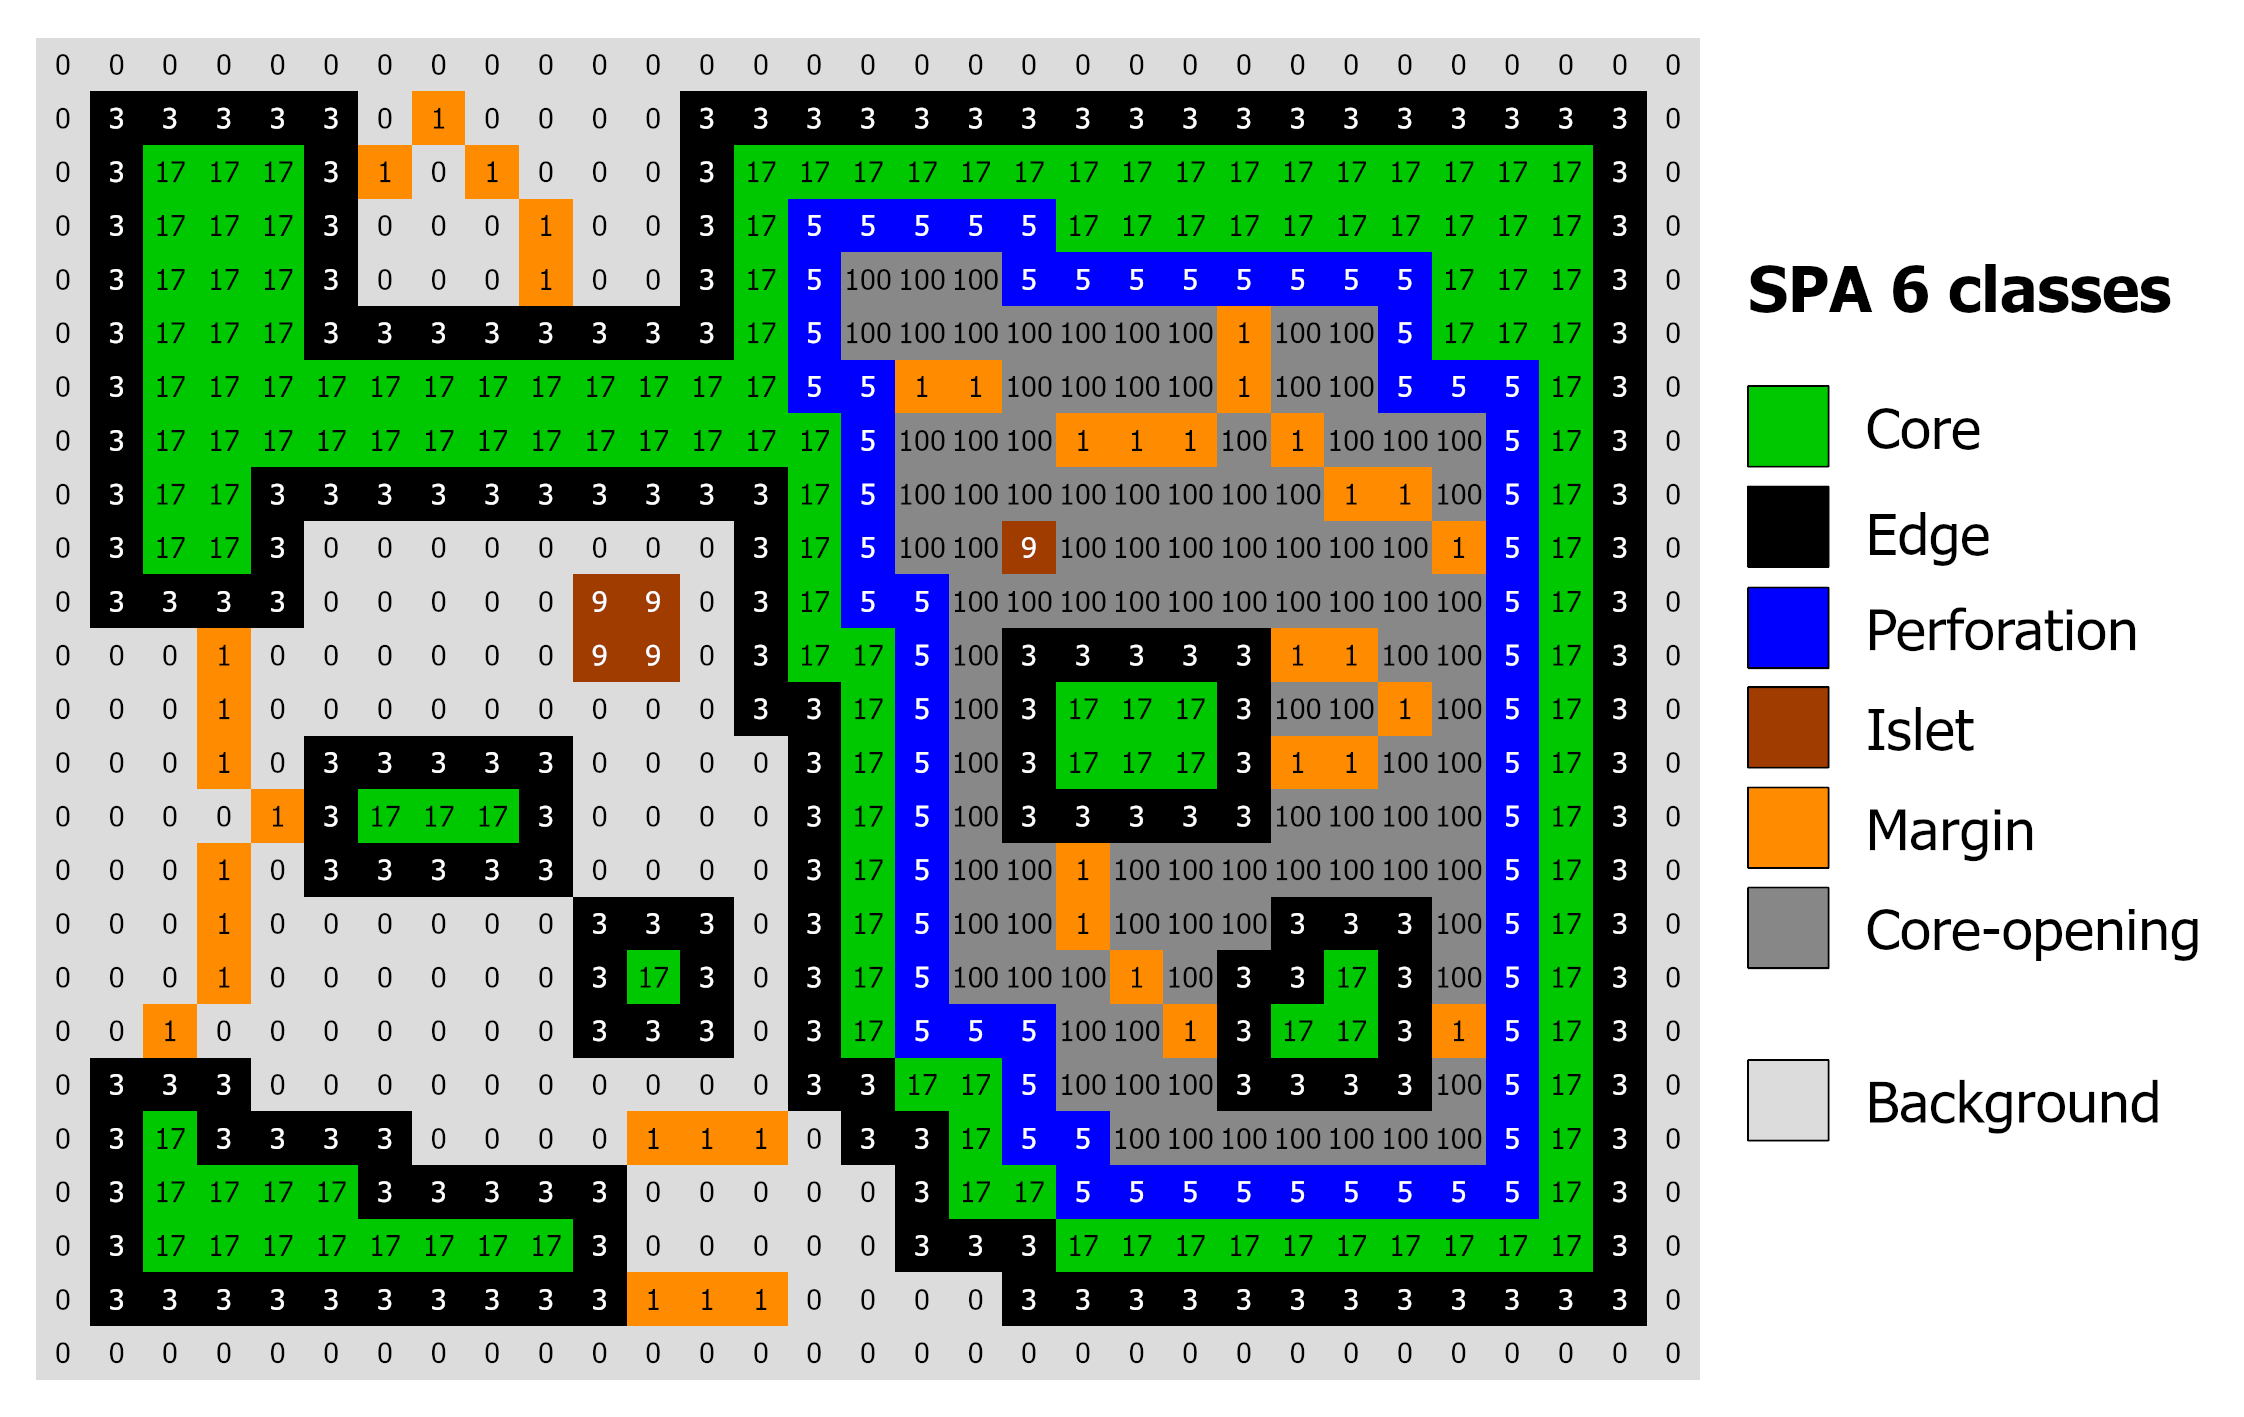
Derived SPA maps with 2, 3, 5 and 6 classes and edge width 1.#
Usage#
import pyguidos as pg

result = pg.spa(
    in_tiff="my_input.tif",
    edge_width=1,
    classes=6,
    outdir="output/",
    statists=True,
    stat_files=True,
    verb=False
)
Parameters#
Parameter |
Type |
Default |
Description |
|---|---|---|---|
|
str or Path |
– |
Path to input GeoTIFF (0=NoData, 1=Background, 2=Foreground) |
|
int |
– |
Width of the edge zone in pixels (>= 1) |
|
int |
6 |
Number of morphological classes (2, 3, 5, or 6) |
|
str or Path |
None |
Output directory. Defaults to input directory |
|
bool |
True |
If True, computes and returns statistics |
|
bool |
True |
If True, writes a .txt report file |
|
bool |
False |
If True, prints progress messages |
Output Files#
File |
Description |
|---|---|
|
SPA result GeoTIFF with color palette |
|
Statistics report |
Results#
The spa() function returns a dict with the following structure:
- output paths (
dictorNone) path tif (
str): Absolute path to the SPA result GeoTIFF.path txt (
str): Absolute path to the SPA statistics report.Note: This key is
Noneifstat_files=False.
- output paths (
- input stats (
dict) foreground pxl (
int): Count of pixels classified as foreground.background pxl (
int): Count of pixels classified as background.missing pxl (
int): Count of NoData pixels.
- input stats (
- output stats (
dict) class freq (
dict): Breakdown of pixel counts for the specific SPA classes chosen.integral foregr (
int): The sum of foreground, background, and core-opening pixels.porosity (
float): Calculated measure of foreground density.
- output stats (
Computing Statistics Separately#
If you already have an SPA output GeoTIFF, you can compute statistics using:
stats = pg.spa_stats(
    spa_tiff="output/my_map_spa_6_1.tif",
    stat_files=True,
    outdir="output/",
    source_tiff="my_map.tif"
)
Note
spa_stats() requires the input GeoTIFF to contain the GTB_SPA metadata tag.
References#
Vogt P, Riitters K, 2017. GuidosToolbox: universal digital image object analysis. European Journal of Remote Sensing 50(1), 352-361. DOI: 10.1080/22797254.2017.1330650.
Soille P, Vogt P, 2009. Morphological segmentation of binary patterns. Pattern Recognition Letters 30(4):456-459. DOI: 10.1016/j.patrec.2008.10.015